|
|
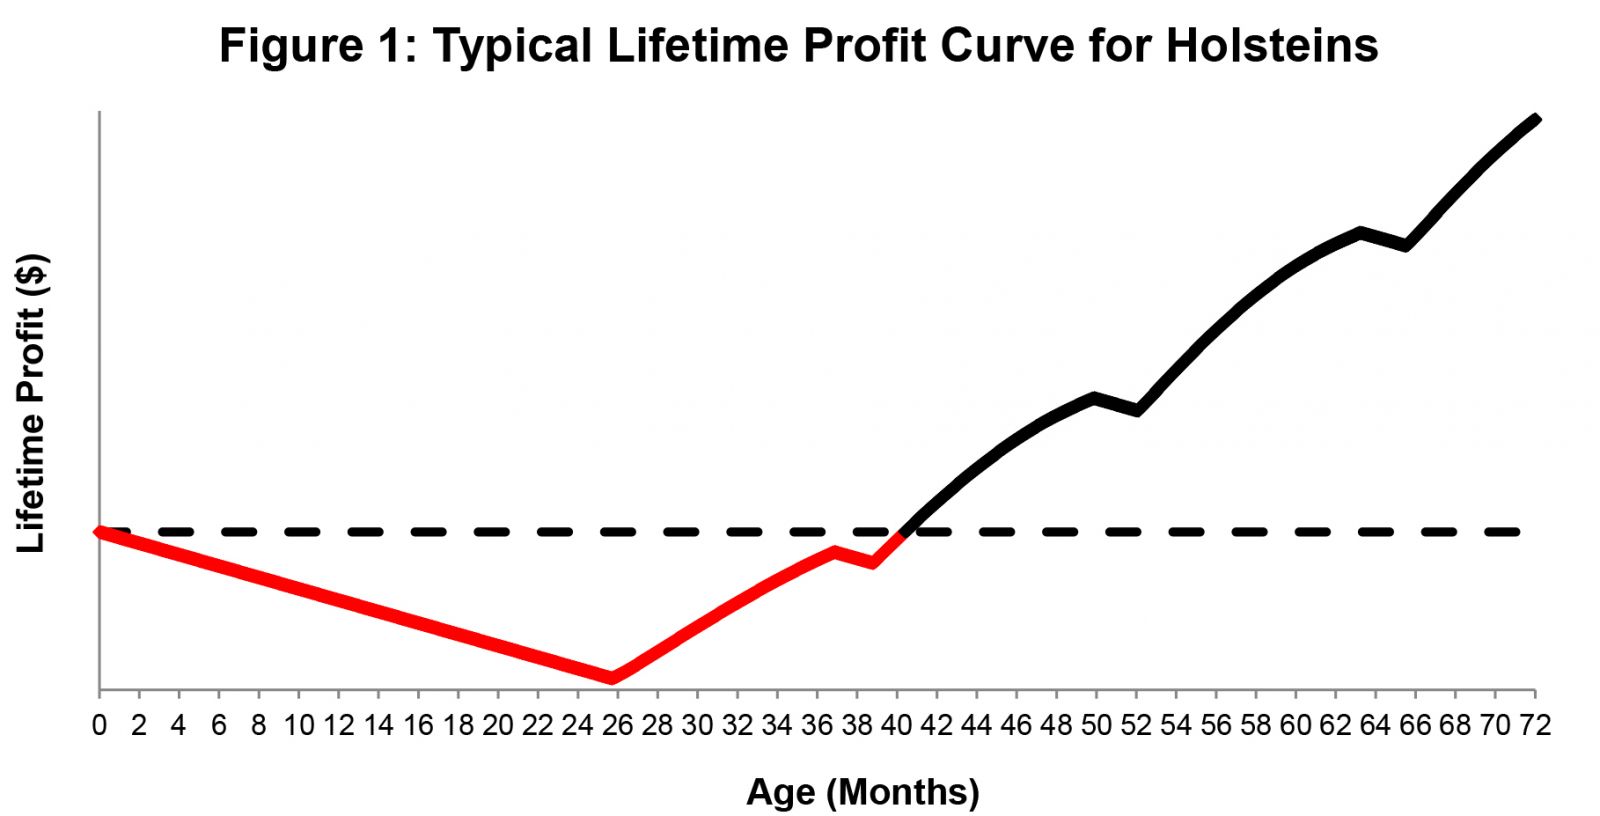
Understanding Pro$ and the Lifetime Profit Curve 23-AUG-2016 August 2016 marks one year since the introduction of Pro$ as one of Canada's national genetic selection indexes. Since its inception, Pro$ has been well received by both producers and industry personnel. As a genetic selection tool, Pro$ maximizes genetic response for lifetime profitability, leading to realized daughter profit on farm. The accumulated profit a cow achieves over her lifetime depends on several contributing factors, all of which are reflected in the Pro$ index. Let's take a closer look to better understand how Pro$ can help Canadian producers develop a herd of profitable cows. Lifetime Profit Curve From the day a heifer calf is born, she starts to incur costs, the majority of which are related to feeding. With an average age at first calving near 26 months, the cost of heifer rearing is roughly $2,800 for Holsteins. Once calved and lactating, a dairy cow starts to generate her primary source of revenue - milk and its components. At the end of each lactation, no revenue is generated during the dry period but expenses continue. This concept of describing how a cow's profit accumulates over time is its lifetime profit curve, which is shown in Figure 1 for the typical Canadian Holstein. This lifetime profit curve covers the first six years of life since this was the definition of lifetime profit used by Canadian Dairy Network (CDN) to develop Pro$.
For the typical Holstein in Canada, the complete repayment of costs incurred from birth is achieved by 40 months of age, at which time she is in her second lactation (Figure 1). Looking closely, it can be seen that each new dry period and subsequent calving leads to higher levels of accumulated lifetime profit compared to the scenario of a cow having only one calving followed by years of consecutive production. Normally, prior to reaching six years of age, the typical cow will have had four calvings, including three dry periods, and is in progress on her fourth lactation. This underlying cycle of reproduction and production is fundamental to the dairy enterprise since heifer calves are required as future replacement animals for the milking herd. On average, about one-third of all lactating Holsteins in Canada stay in the herd to at least the age of six years. Those that do, typically end up with about 40 months of productive life in lactation along with six months for dry periods. When producers aim to maximize herd profitability, it is important to think of the factors contributing to each cow's lifetime profit curve, which include:
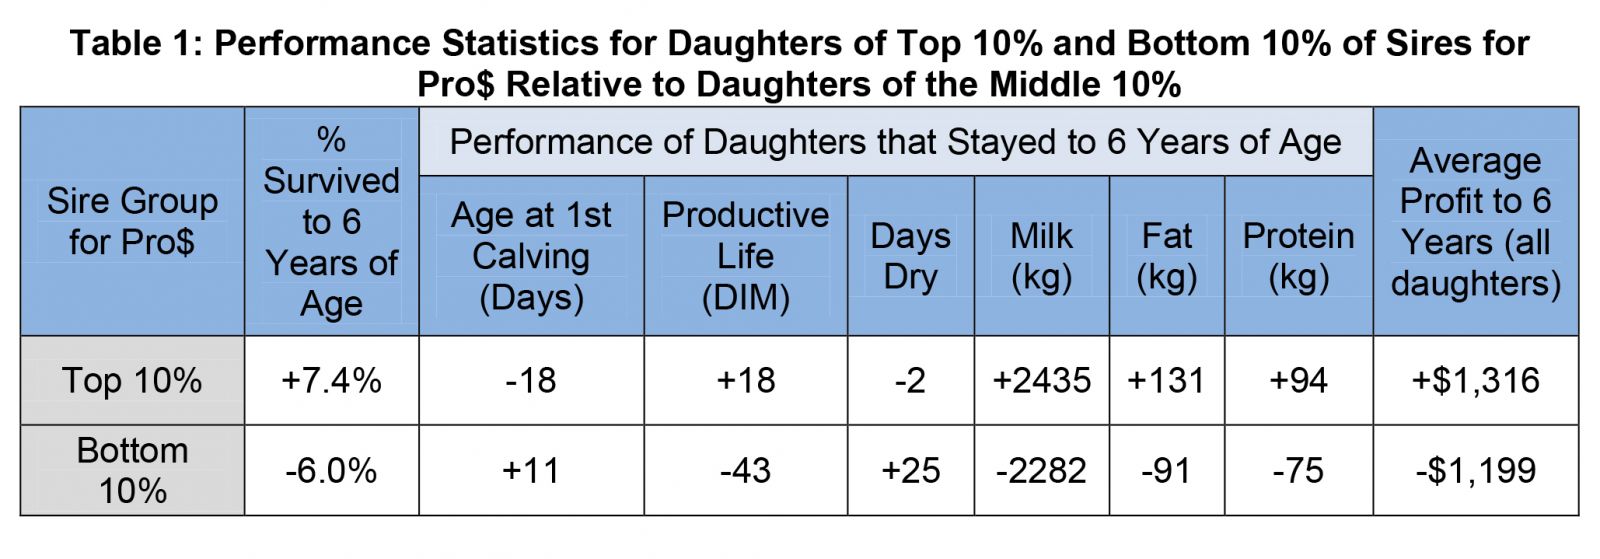
When examining Pro$ values, higher bulls are expected to produce more profitable daughters compared to lower Pro$ bulls. This means that the average lifetime profit curve for daughters of high Pro$ sires will be somewhat different, and higher, compared to daughters of poorer Pro$ sires. CDN recently conducted an analysis to help demonstrate how the key factors contributing to a cow's lifetime profit curve vary between sires that are higher or lower for Pro$. To conduct this analysis only older sires could be used since their daughters would have to have been born early enough to have had the opportunity to reach six years of age. Table 1 provides various statistics describing the performance of daughters of the sires that were in either the top 10% for Pro$ of the group included in the analysis, or the bottom 10% for Pro$, relative to the daughters of the middle 10% of sires for Pro$.
Relative to daughters of the middle group of sires for Pro$, 7.4% more daughters of the top Pro$ sires and 6.0% fewer daughters of the bottom Pro$ sires stayed in the herd to six years of age. Evidently, longevity is a crucial component of lifetime profitability. By looking specifically at the daughters that stayed in the herd until at least six years of age, we can illustrate the profitability differences, beyond longevity, that exist between the two sire groups based on Pro$. For example, daughters of the top group for Pro$ calved younger, had more days of productive life and produced more milk, fat and protein than daughters of average Pro$ sires. On the other hand, daughters of the bottom sire group for Pro$ had an older age at first calving, fewer days in production, spent more days dry and produced significantly less than daughters of average Pro$ sires. Since all these performance measures impact profitability, there is a clear difference in the average accumulated profit to six years of age, based on all daughters, for each of the two sire groups by Pro$. Daughters of the top sire group for Pro$ generated an extra $1,300 profit to six years than daughters of the middle sire group, while daughters of the bottom sire group generated $1,200 less profit to six years than daughters of the middle group. Bottom line is that selecting sires based on Pro$ produces daughters with higher lifetime profit curves and improved herd profitability. Authors:
|