|
|
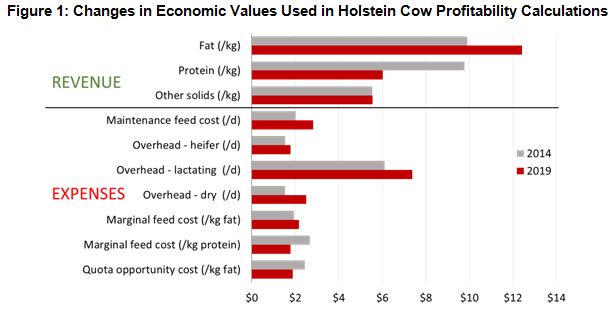
Pro$ & LPI: Enhancements and Updates 28-FEB-2019 Pro$ was introduced in August 2015 as a selection tool to maximize genetic response for daughter lifetime profitability. Since that time, producers, A.I. companies, breed associations and other industry organizations have been quick to embrace this index. Over the course of the last three years, significant changes in milk pricing and expenses have occurred. In addition, the accumulation of more data, as well as the opportunity to add new traits and expenses unavailable in 2015, led CDN to pursue updating the Pro$ formula. LPI updates were also made last in 2015, so updating both indexes simultaneously was logical. In this article, learn about the updates to each national index, which are effective with the April 2019 genetic evaluation release. What has Changed since Pro$ was Launched? The backbone of Pro$ is cow profitability data from Valacta and CanWest DHI - data that comes directly from Canadian dairy farms. Annually, economists update the economic parameters used to derive profit values for each cow in order to assure their relevancy. Due to changing market conditions, component pricing has changed substantially in favor of fat production since Pro$ was introduced in 2015. Overhead costs and feed costs have also seen significant change. All economic values used in cow profitability calculations from 2014 and 2019 are seen in Figure 1 and can be useful when assessing where the major updates to Pro$ originate.
Two other important improvements to cow profit values include the modification of expenses to reflect cow differences in terms of reproduction and maintenance costs. On the reproduction side, the overall profit calculation used by CDN now accounts for the total number of inseminations performed for individual cows up to six years of life or disposal. In terms of maintenance costs, previously, these varied across breeds but not between animals of different sizes within a given breed. Using Holstein Canada body weight measurements and certain linear and measured conformation traits, CDN developed an estimation for relative body size and modified maintenance costs accordingly. Combined, these changes mean a sire whose daughters require more inseminations to get pregnant and higher maintenance costs than average, for example, will have lower average daughter profit and Pro$ as a result. Some final changes to Pro$ since its initial release include the addition of nearly four more years of cow profit data, an updated Pro$ formula specific to the Jersey breed, as well as the availability of Pro$ evaluations for the first time in the Ayrshire breed. A Refresher on How Pro$ is Calculated In brief, the steps for calculating Pro$ include:
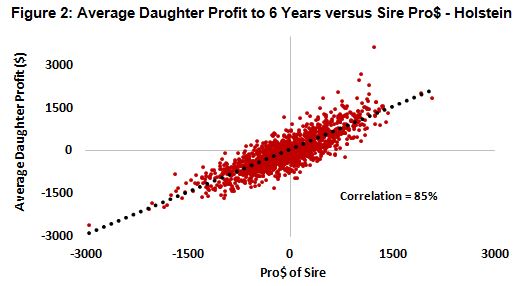
Relating Pro$ to Daughter Profit Pro$ is expressed in dollars as a deviation from breed average. For example a bull with a Pro$ of $2000 can be expected to sire daughters that have an average accumulated profit to six years that is $500 higher than daughters of a bull with $1500 Pro$. In other words, selecting sires with a higher Pro$ value will translate directly into increased average lifetime profit of the resulting daughters. This concept is illustrated in Figure 2.
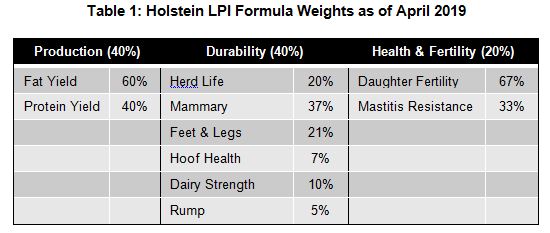
Holstein LPI Updates CDN works closely with breed associations when updating their respective LPI formula. With Holstein Canada, it was decided that the Holstein LPI will maintain the overall component weights of 40% Production, 40% Durability and 20% Health & Fertility. However, weights have shifted on traits within components and two new traits were added to the formula. More specifically:
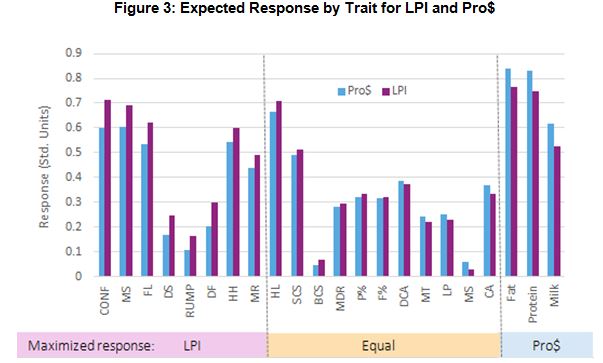
Comparing the Updated LPI and Pro$ The correlation between the updated LPI and Pro$ is 97%, meaning animals will rank somewhat differently for one index versus the other, depending on their combination of traits. So how do you determine which index best aligns with your goals? First off, it is important to realize that lifetime profit can be defined differently from farm to farm, depending on the sources of revenue and associated expenses. While Pro$ is targeted to meet the needs of producers who generate essentially all their revenue from milk sales, LPI retains the interests of those who desire to market genetics domestically and abroad. Compared to LPI, using Pro$ as your primary index will maximize production yields and maintain functional traits and conformation at a level necessary to sustain high yields (Figure 3). On the other hand, using LPI as your primary index will lead to a herd with exceptional conformation, superior Daughter Fertility, Hoof Health, Mastitis Resistance and good Fat and Protein yields. No matter which index you align yourself with, you can be confident that all of the information that feeds the traits in each index is sourced directly from Canadian dairy farms.
Updating Indexes Going Forward April 2019 will see the release of an enhanced Pro$ formula, which will allow for selection for optimal daughter profitability in today’s market conditions. In addition, LPI updates include the addition of trait weightings to better reflect market demands, as well as new traits to reflect breed association goals. In general, national indexes are updated every few years as market conditions or breed goals evolve. However, if important changes occur in our industry, for example to favour fat production to an even greater extent, indexes will be updated more frequently to reflect these changes. Authors:
|