|
|
How do Production Proofs Relate to Average Daughter Yields? 23-JAN-2017 The concept is certainly not new; in North America we have been genetically selecting for production for many decades. Strategies to do so, of course, have evolved over time. What has remained important is that users understand the relationship between sire proofs and the expected performance of daughters. Bull proofs for production traits can be hard to interpret since proof expression, units and genetic base definitions differ across countries. Let's refresh our memories in terms of production proof expression, interpretation and associated expected daughter performance. Interpreting Production Proofs Prior to publishing the genetic evaluation for each trait, each bull's proof and cow's index must be expressed on a scale that is meaningful and leads to a relatively easy interpretation of the published values. This is done by defining a group of animals which are used as the reference group, often referred to as the "genetic base". For production proofs, a cow base is used, meaning that the average genetic evaluation for all cows born during the base period is set to zero and all other animals receive an evaluation expressed as a difference from that average. The genetic merit of each animal can be expressed as an Estimated Breeding Value (EBV), as is done in Canada, or a Predicted Transmitting Ability (PTA), as is done in the US. In mathematical terms, a PTA is simply half of an EBV, but for the reasons previously outlined Canadian EBVs cannot be directly compared to US PTAs. Production proofs are calculated using the Canadian Test Day Model, which uses daughter test day records from the first three lactations to calculate the sire's proof for milk, fat and protein yields in first, second and third lactation separately. These lactation EBVs are averaged to produce a combined proof as the overall EBV Milk, which is the value that producers are used to seeing on proof sheets, CDN's website and elsewhere. Production EBVs provide an estimate of each animal's superiority or inferiority compared to animals with a rating of zero. Based on an animal in question, how does one interpret production proofs in terms of expected performance?
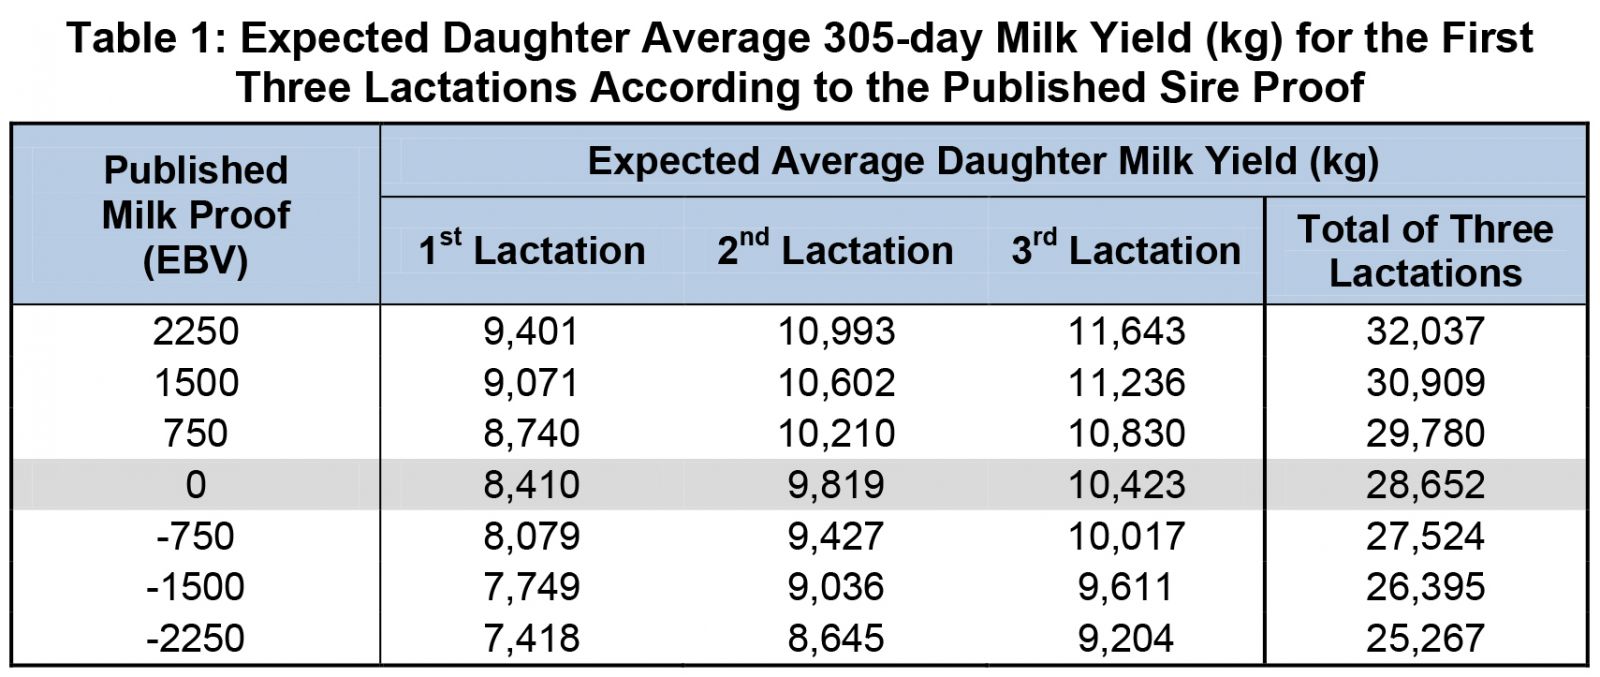
Bull Proofs for Production Traits and Average Daughter Yields In order to quantify the average level of daughter production that is associated with differences in bull proofs for milk, fat and protein yields, official proofs for bulls born from 2005 to 2009 were compared to the average 305-day lactation records for their daughters in each of the first three lactations. The tables show the average level of daughter performance in each lactation for milk, fat and protein that is expected depending on the published overall proof of their sire.
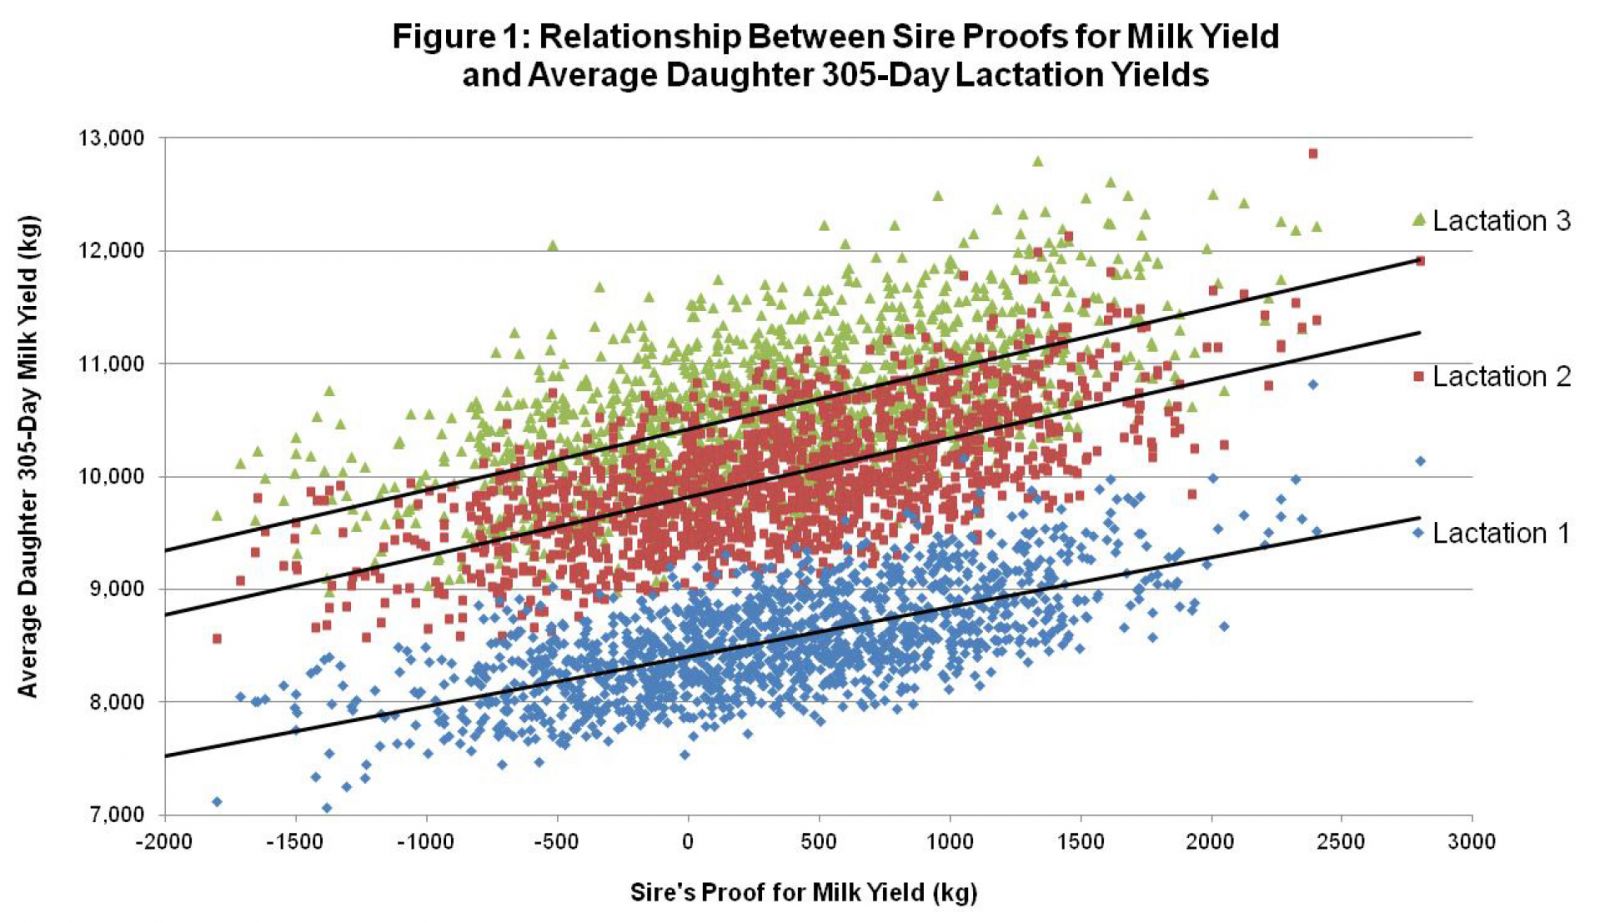
Table 1 shows that the expected 305-day yields for average daughters of a sire with a Milk proof of zero are 8,410 in first, 9,819 in second and 10,423 in third lactation, assuming these daughters had average dams and are in herds with typical management. For higher ranking sires with a Milk proof of at least +2250, the expected average 305-day production across the first three lactations exceeds 32,000 kg, which is nearly 3,400 kg higher than daughters of a sire with a proof of zero. This concept is further illustrated in Figure 1 with second lactation yields averaging 17% more milk than in first lactation while the increase to third lactation is 6% more than in second.
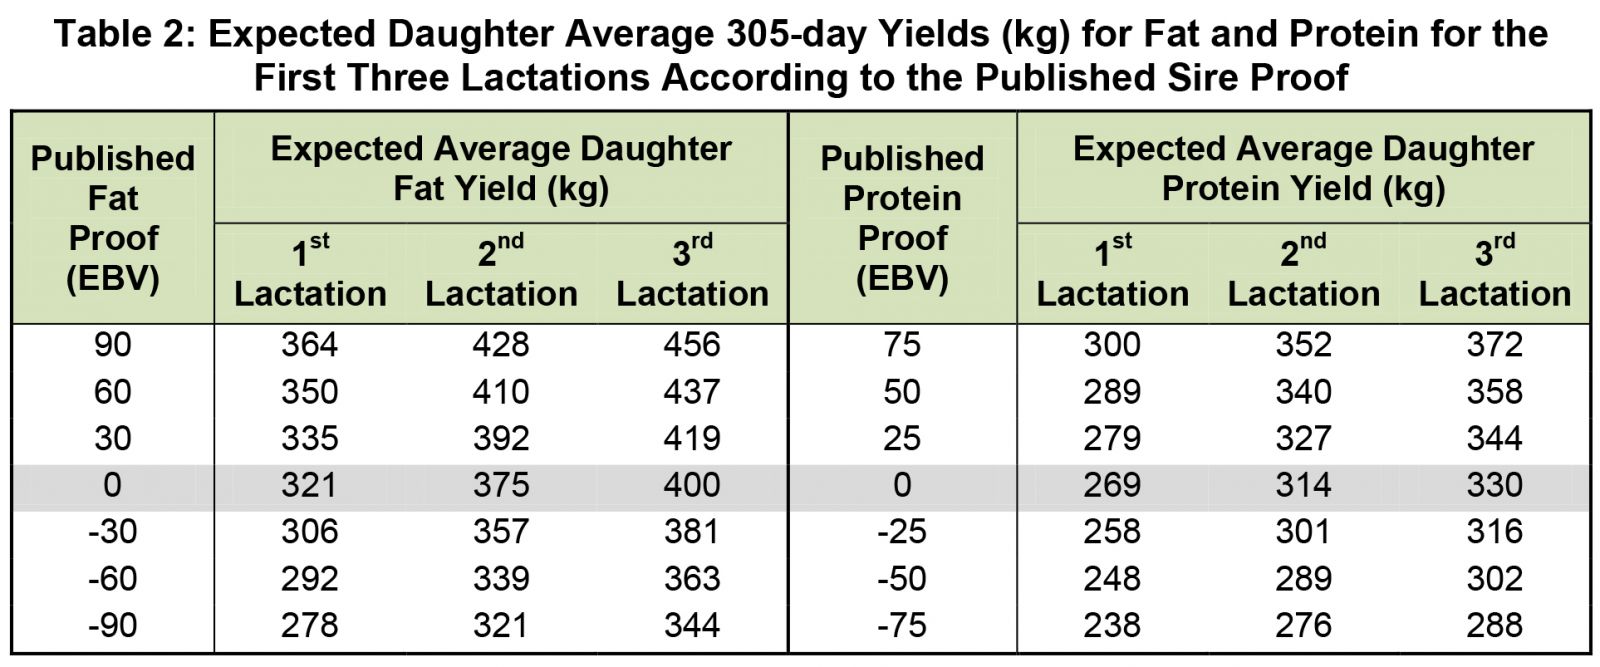
Similar relationships between proofs and average daughter yields for fat and protein are shown in Table 2. It is important to realize that if your herd management is better than average, the expected average daughter yields will be conservative. While this is true for actual expected yields, differences in sire proofs reflect the expected difference in average production of resulting daughters regardless of what herd they are in.
With each passing year, new traits impacting profitability are being released. However, let's not forget the original, still ever so important key profit traits - Milk, Fat and Protein. As we saw in this article, bulls with superior production proofs sire daughters with higher lactation yields. In other words, production proofs work! Authors:
|